The Problem
ClickHouse is fast, until it isn’t. A query that ran in 200ms yesterday suddenly takes 30 seconds, and you need to figure out why. Or a query fails with a cryptic error and you want to see what happened.
The built-in /play endpoint lets you run queries, and that’s about it. No profiling, no history, no way to dig into what a query is actually doing. You end up writing manual queries against system.query_log, system.trace_log, and a handful of other system tables, piecing together timestamps and IDs by hand.
The tools that do exist (CHUI, various GUI clients) are built for running queries. Debugging a slow query or investigating a failure? Not their focus. There was nothing that treated ClickHouse’s system tables as a first-class debugging interface.
So I built one. Well, I vibecoded one.
What Is It?
ClickLens (formerly ClickHouse Query Analyzer) is a single-binary web application that connects to any ClickHouse instance and gives you a proper debugging workspace. You run it, point it at your ClickHouse server, and get flame graphs, thread breakdowns, query fingerprints, a SQL editor with schema browsing, and a table optimizer that generates concrete DDL recommendations. Over time it grew into a full operations console as well, with monitoring for replication, the distributed DDL queue, mutations, and part merges across a cluster.
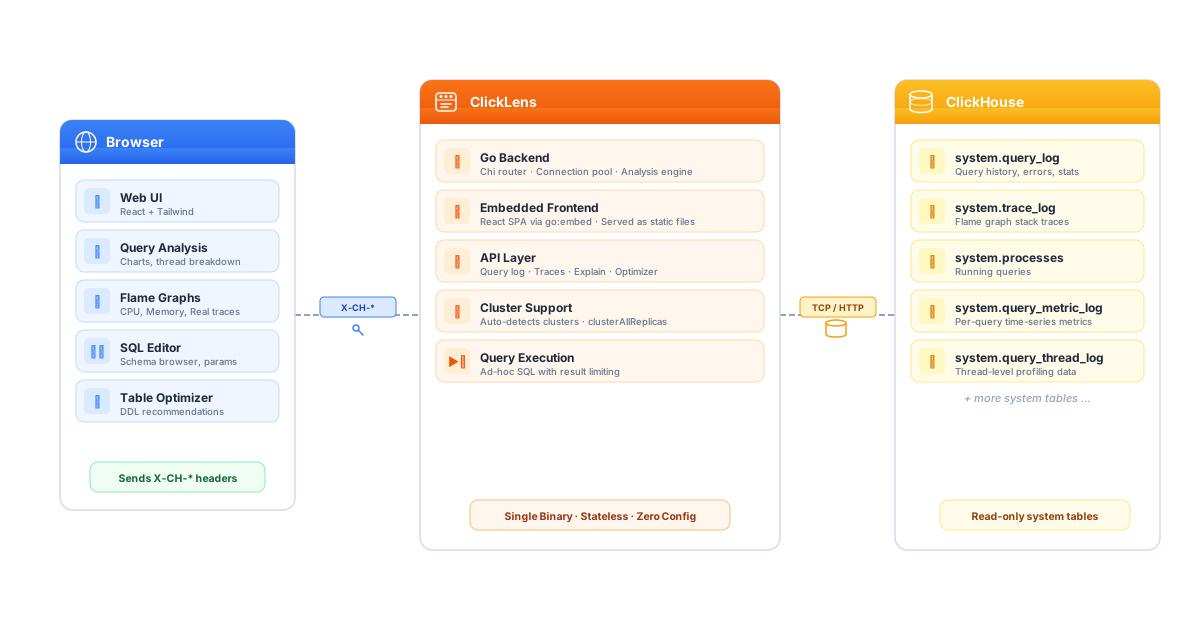
No database to set up. No config files. No state stored server-side. Connection parameters are sent per-request from the browser, so the backend stays stateless.
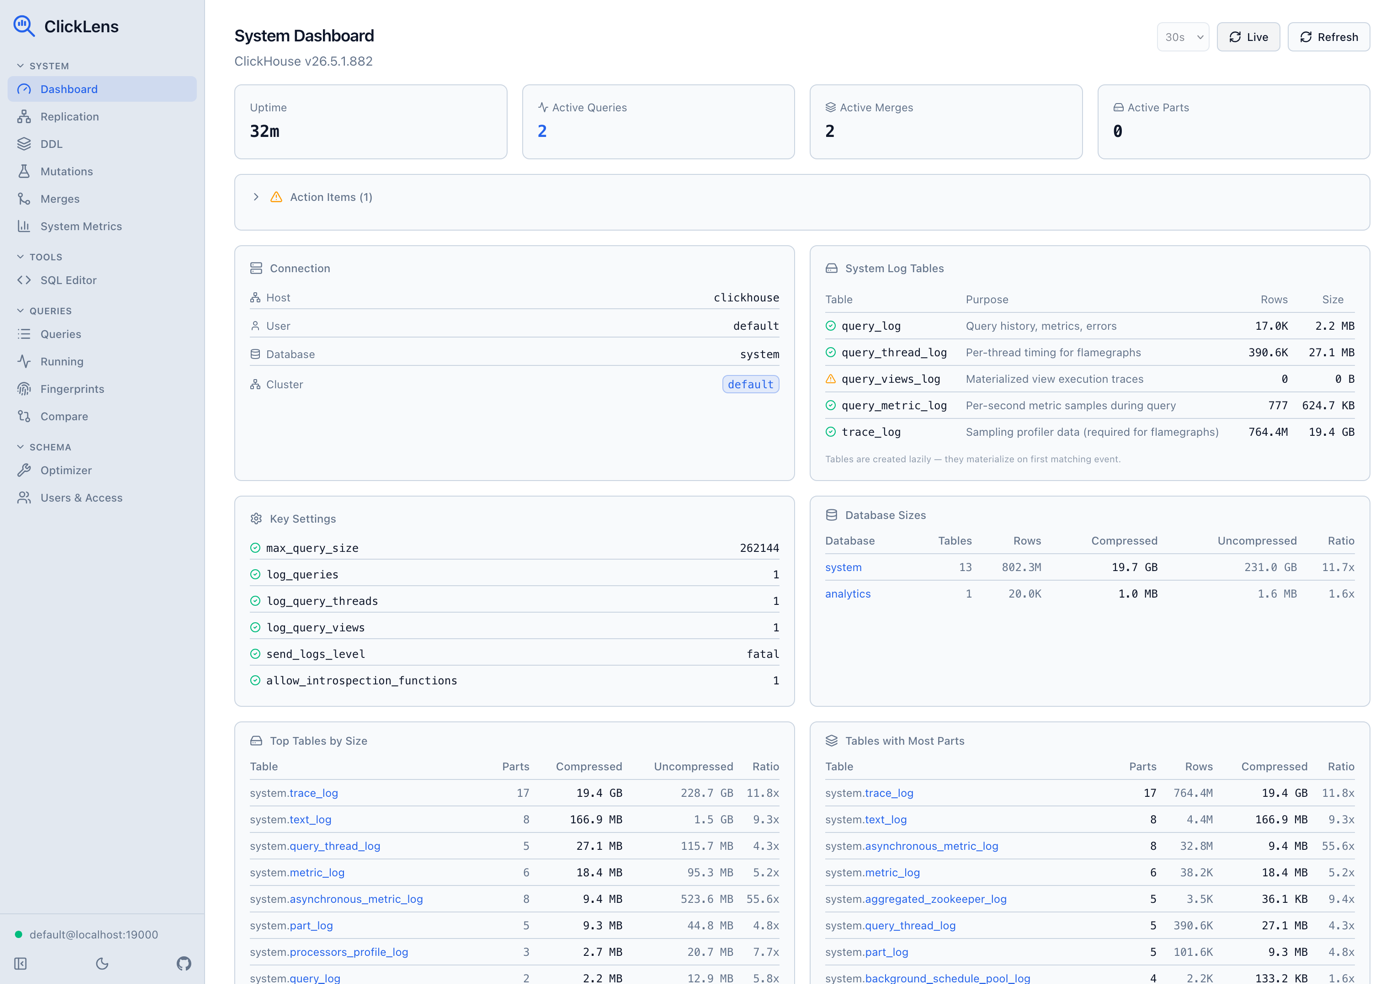
Query Analysis
The query list pulls from system.query_log with filters for time range, user, query kind, minimum duration, memory usage, and full-text search. Failed queries show up too, which was the original reason I started this. Click into any query to see time-series charts for RAM, CPU, and I/O, a breakdown of ProfileEvents, per-thread role inference (which threads are doing aggregation vs. scanning vs. I/O), and memory allocation details.
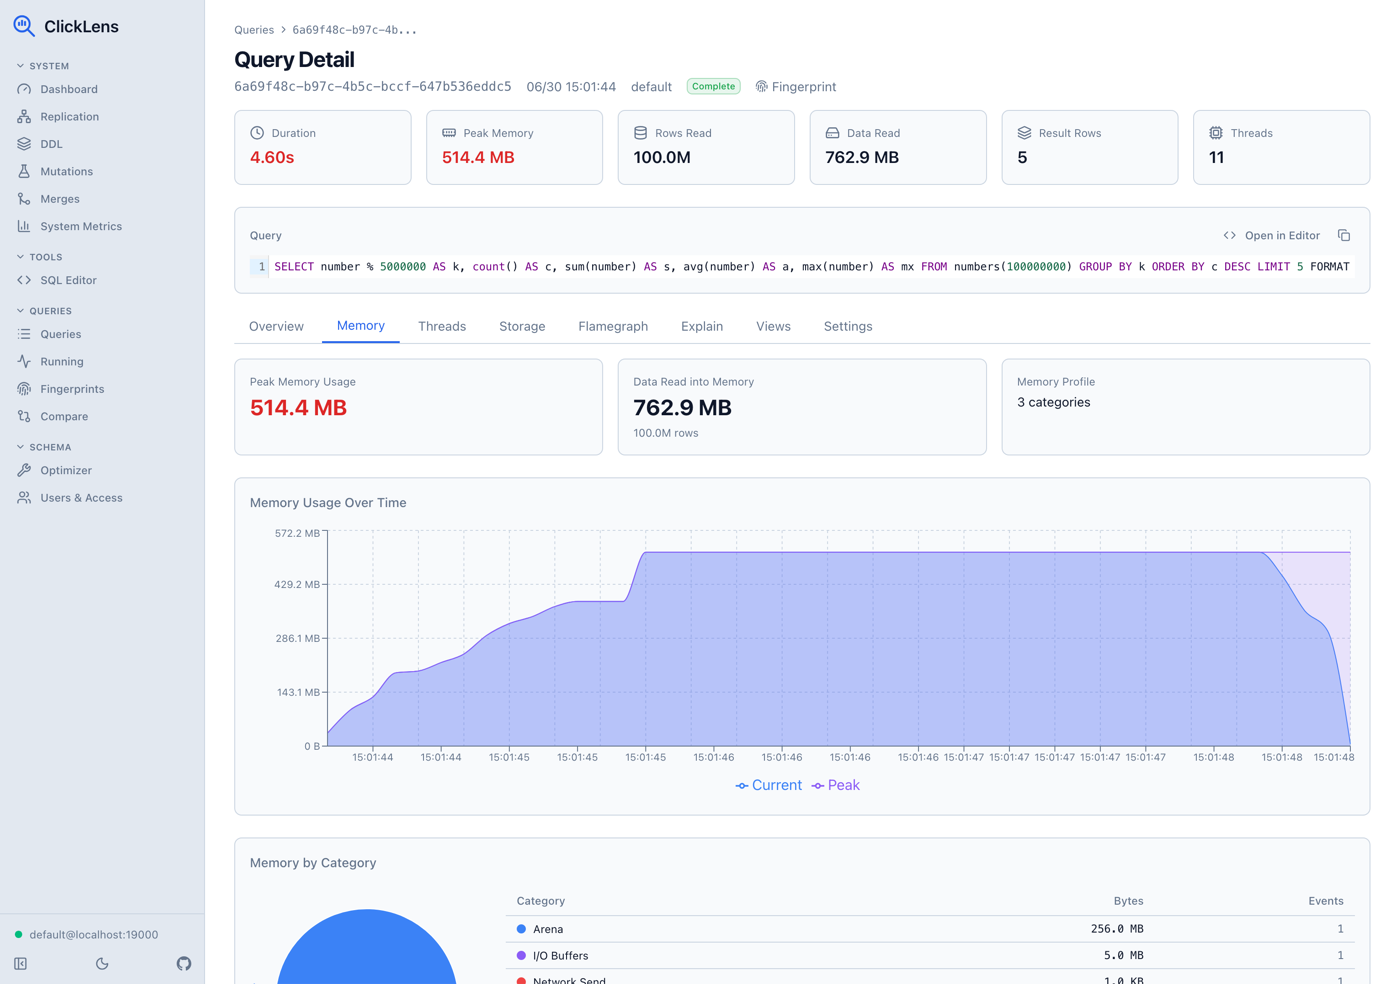
This is the view I kept missing: seeing what a query actually did, not just that it took 12 seconds.
Flame Graphs and EXPLAIN
ClickLens builds canvas-based flame graphs from system.trace_log, supporting five trace types: CPU, Real, Memory, MemorySample, and MemoryPeak. You get the standard zoom-in-on-hover behavior, so you can quickly find where time is being spent.
Alongside flame graphs, there’s an interactive EXPLAIN tree view that renders the execution plan as a collapsible tree, plus raw pipeline and syntax views for the full picture.
Query Fingerprints
Query fingerprints group queries by normalized_query_hash: same query structure, different parameter values. This lets you see aggregated stats per fingerprint: count, average, P50, P95 latency, memory usage, and I/O. Drill into a fingerprint to see performance trends over time at hourly or daily intervals.
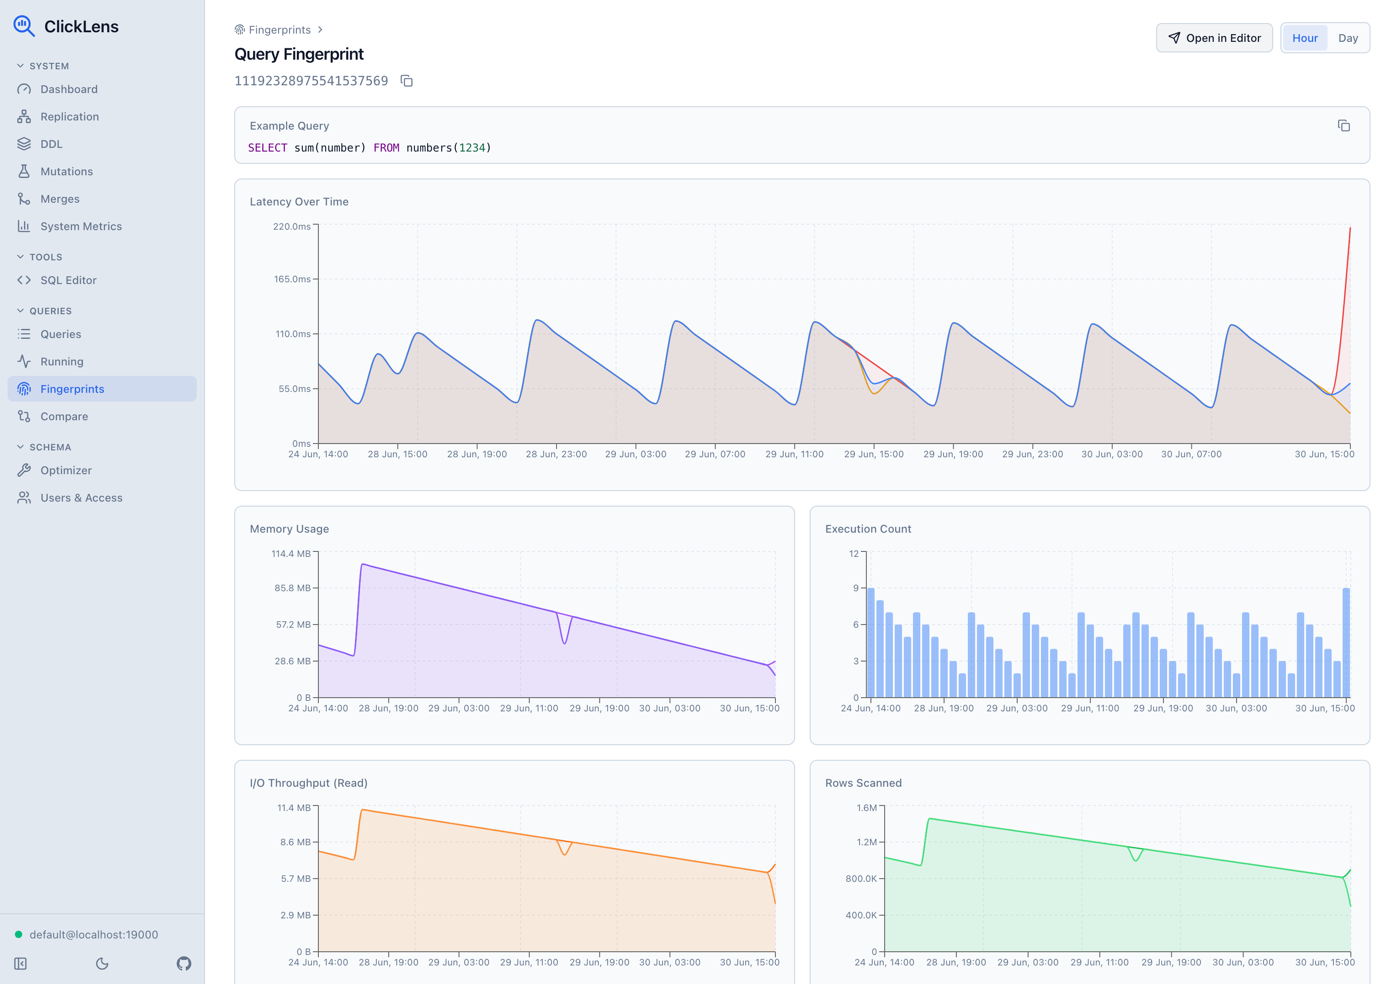
This is useful for catching gradual performance regressions that you’d never notice looking at individual queries.
SQL Editor
A full CodeMirror 6 editor with a schema browser sidebar that lists databases, tables, and columns with types. It supports parameterized queries through a {{param_name}} syntax that auto-generates input fields, and saved queries that live in your browser’s localStorage and can be imported or exported. Results link directly to the analysis view. Run a query, then jump straight into profiling it.
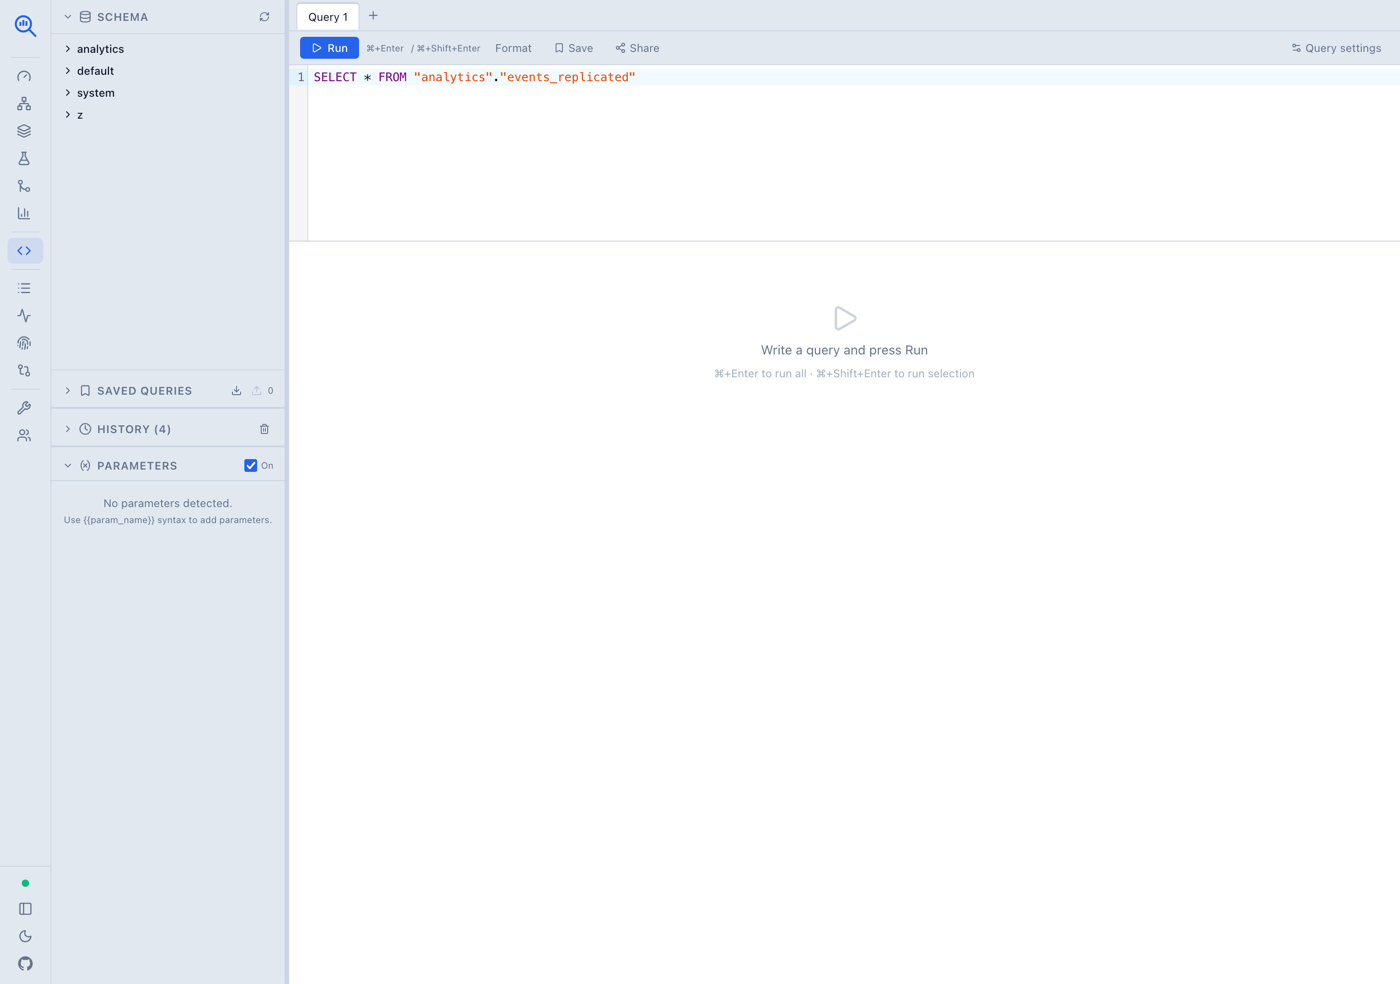
Table Optimizer
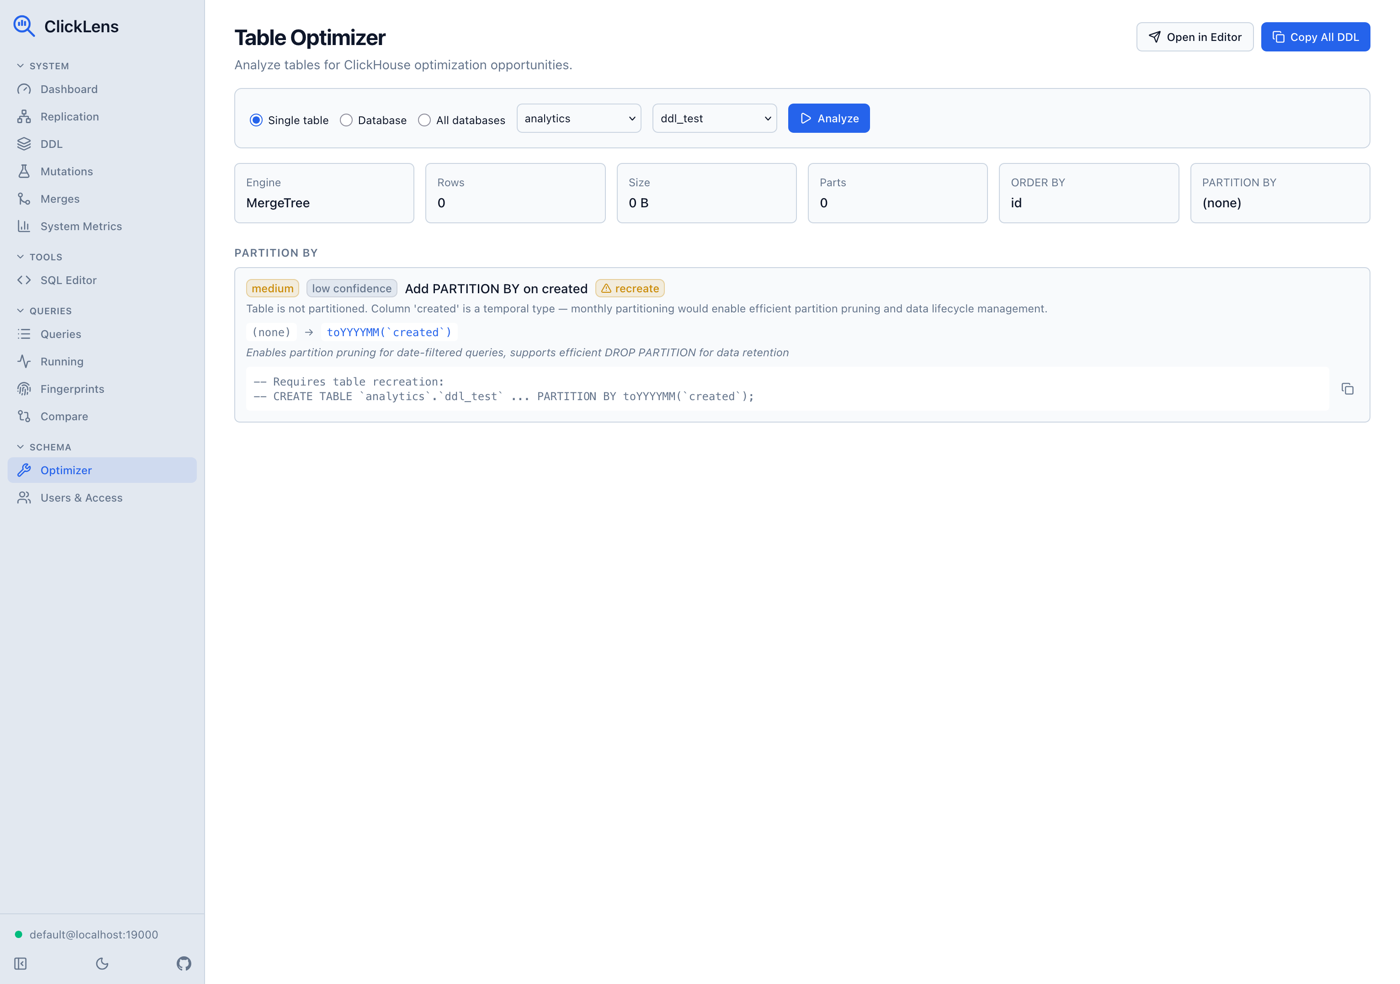
This is the feature that surprised even me in how useful it turned out to be. Point the optimizer at a table, a database, or all databases, and it samples column data to generate concrete ALTER TABLE recommendations:
- LowCardinality wrapping for string columns with low cardinality ratios
- Integer right-sizing: suggesting
Int32instead ofInt64when the data fits - Nullable removal for columns that have zero nulls in the sample
- Codec suggestions: DoubleDelta for sequential timestamps, ZSTD for high-cardinality strings
- Partitioning and skipping index recommendations
- Health checks: excessive parts, high bytes-per-row ratio
Each recommendation comes with a severity level, confidence rating, and copy-ready DDL.
Cluster Operations
Once I started using ClickLens on a real replicated cluster, the missing pieces became obvious fast. A query is only half the story when replication is lagging, an ON CLUSTER DDL is stuck, or a mutation is quietly rewriting terabytes. So the tool grew a set of operations views that read the same system tables I was checking by hand.
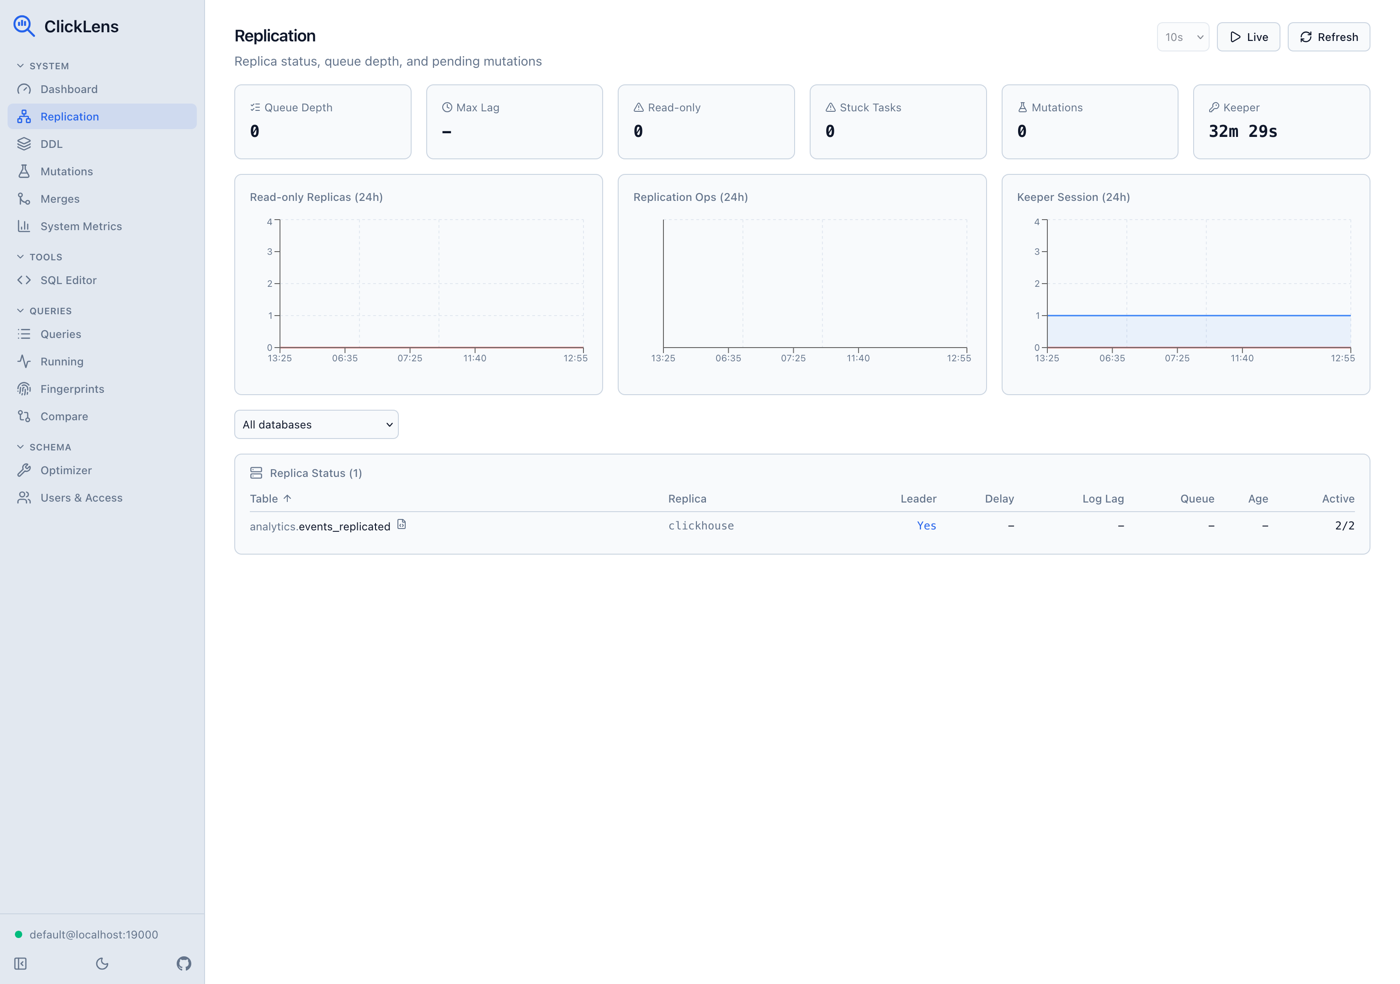
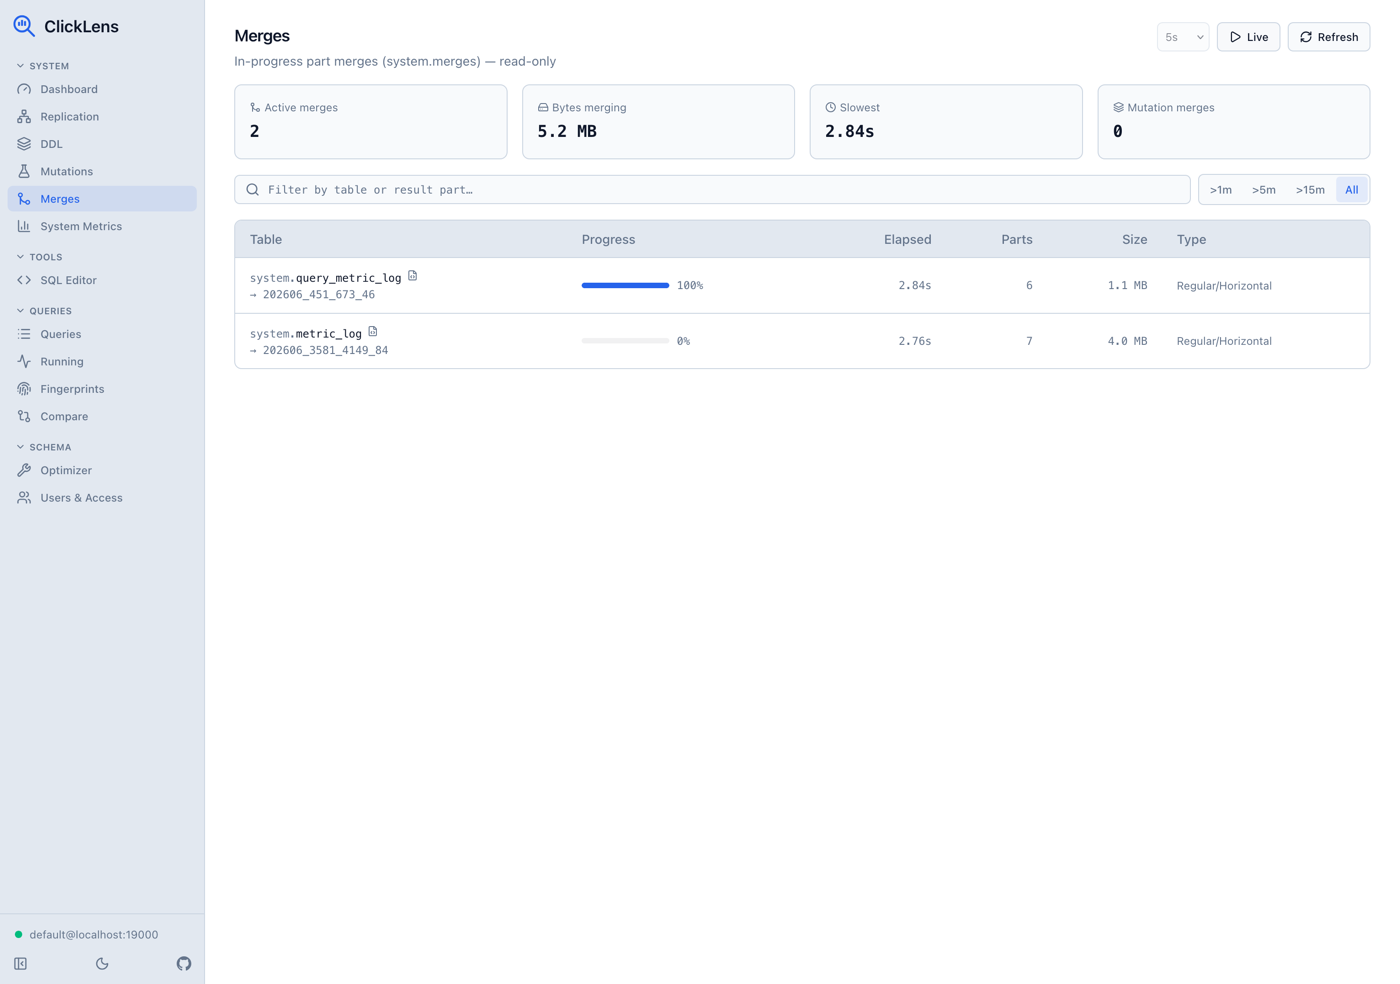
Replication monitoring pulls from system.replicas, system.replication_queue, and Keeper session health, with summary cards and 24h activity charts. The DDL view surfaces the distributed DDL queue and recent schema operations from system.query_log, so stuck or failed ON CLUSTER statements are visible at a glance. Mutations show in-progress ALTER ... UPDATE/DELETE/TTL rewrites with parts-to-do and age, plus a KILL MUTATION action. And merges list in-progress part merges with progress and bytes, all with opt-in live refresh.
Query Comparison
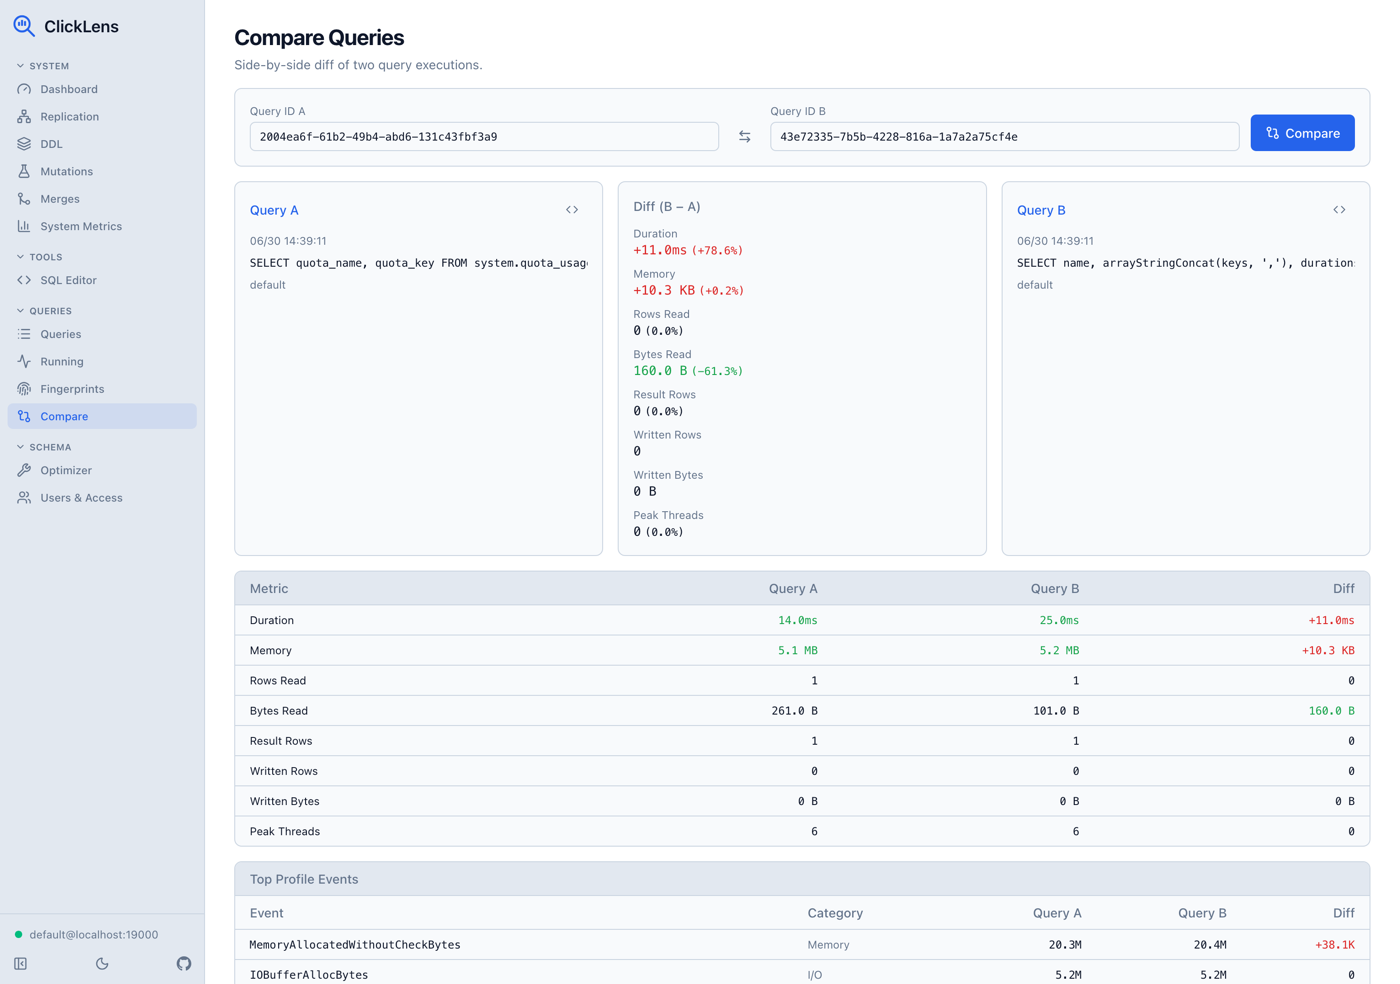
When two queries look similar but perform very differently, comparing them side by side is the fastest way to find the cause. ClickLens diffs two queries, including their ProfileEvents, so you can see exactly where one spends more time or memory than the other.
Users and Access
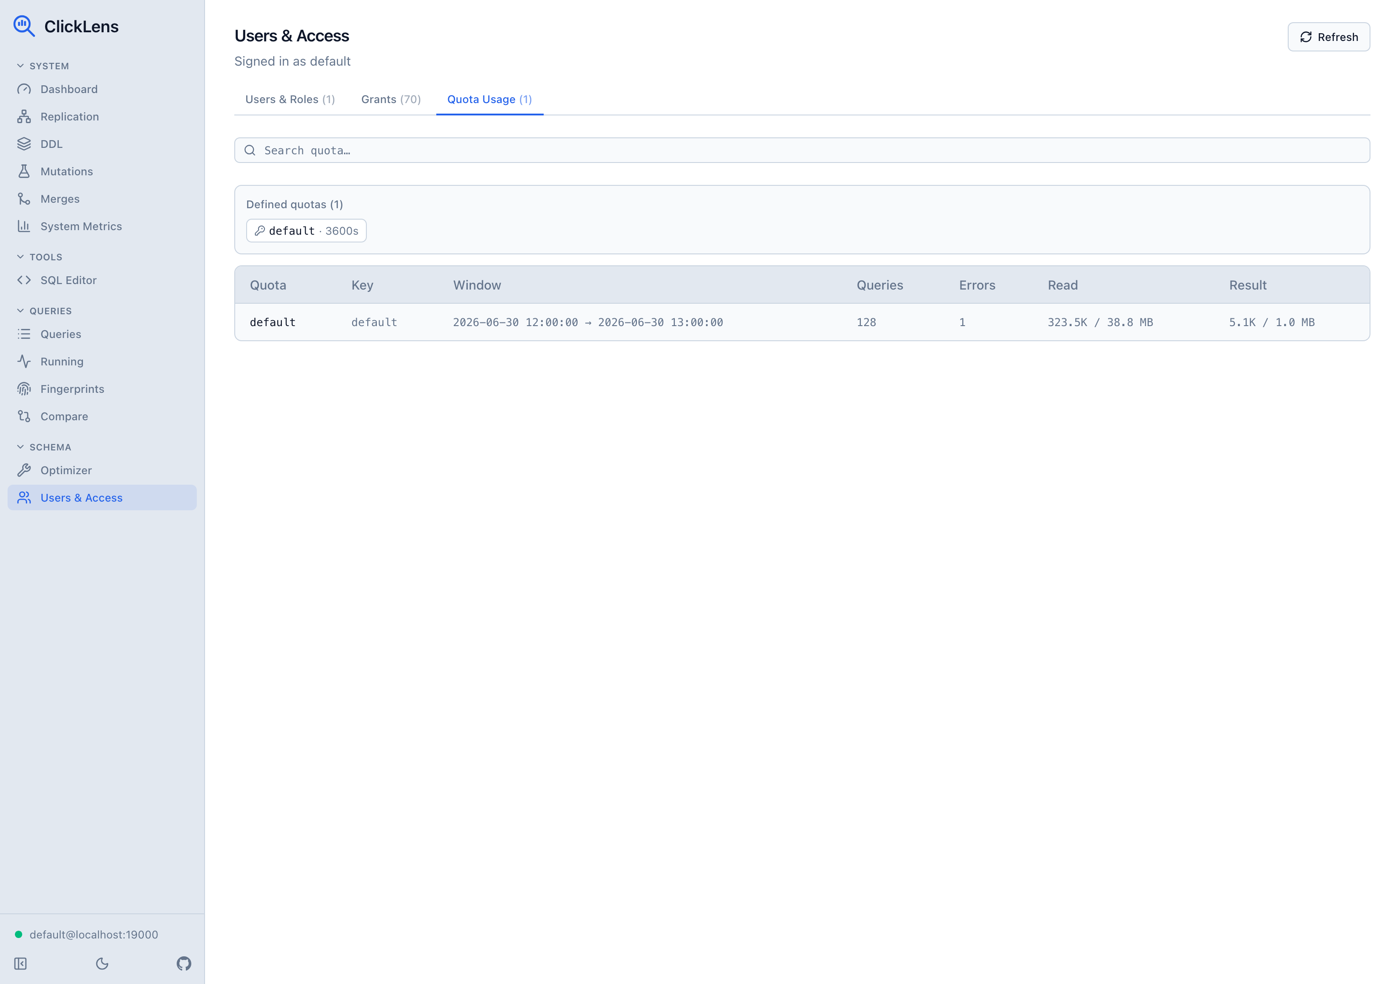
ClickHouse access control lives in system tables, and ClickLens reads them to show users, roles, grants, and quota usage. It’s read-only by default, with permission-gated manage actions like DROP USER/ROLE and REVOKE for when you actually need to make a change without leaving the tool.
Try It
ClickLens is open source and available as a single binary or Docker image. No setup wizard, no config file. Just connect and start debugging.
docker run -p 8080:8080 ghcr.io/nimbleflux/clickhouse-query-analyzer:latestThen open http://localhost:8080, enter your ClickHouse connection details, and you’re in.
- GitHub: Source code, releases, and documentation