The Problem
ClickHouse is fast, until it isn’t. A query that ran in 200ms yesterday suddenly takes 30 seconds, and you need to figure out why. Or a query fails with a cryptic error and you want to see what happened.
The built-in /play endpoint lets you run queries, and that’s about it. No profiling, no history, no way to dig into what a query is actually doing. You end up writing manual queries against system.query_log, system.trace_log, and a handful of other system tables, piecing together timestamps and IDs by hand.
The tools that do exist (CHUI, various GUI clients) are built for running queries. Debugging a slow query or investigating a failure? Not their focus. There was nothing that treated ClickHouse’s system tables as a first-class debugging interface.
So I built one. Well, I vibecoded one.
What Is It?
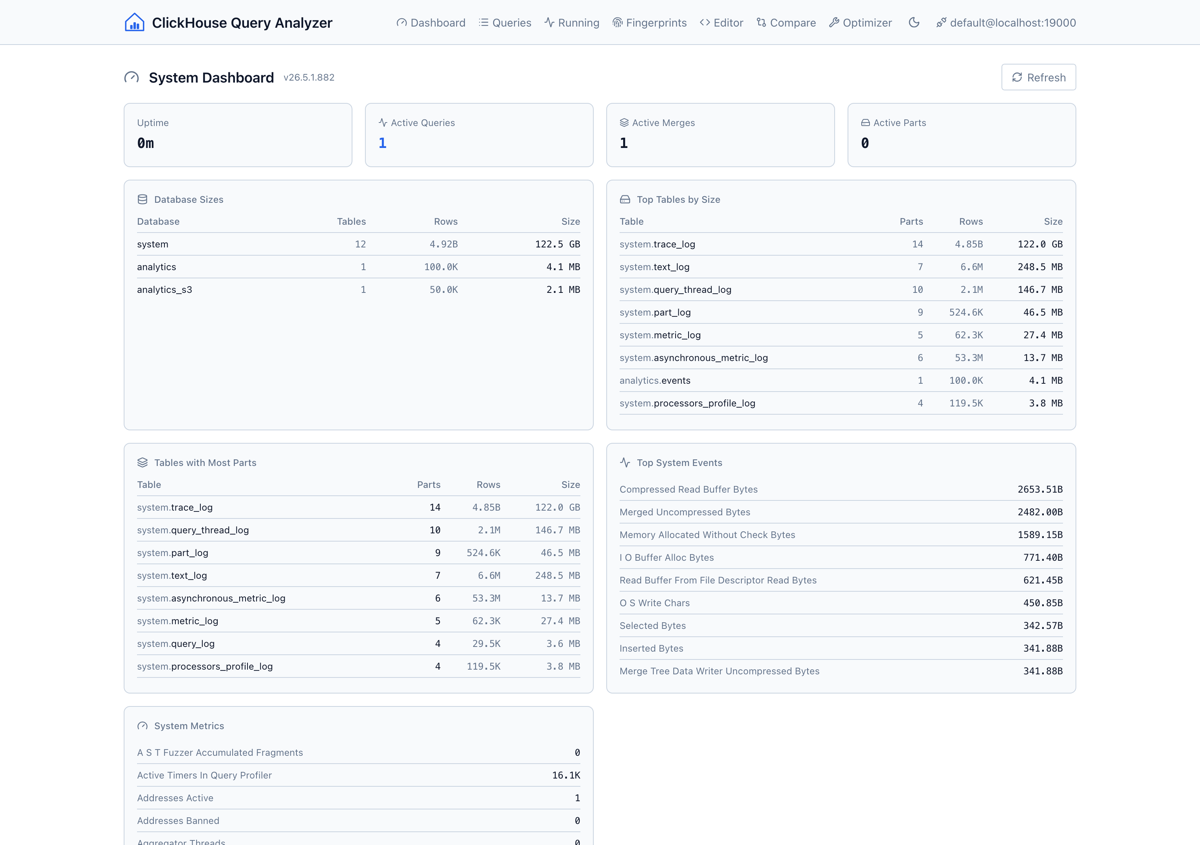
ClickHouse Query Analyzer is a single-binary web application that connects to any ClickHouse instance and gives you a proper debugging workspace. You run it, point it at your ClickHouse server, and get flame graphs, thread breakdowns, query fingerprints, a SQL editor with schema browsing, and a table optimizer that generates concrete DDL recommendations.

No database to set up. No config files. No state stored server-side. Connection parameters are sent per-request from the browser, so the backend stays stateless.
Query Analysis
The query list pulls from system.query_log with filters for time range, user, query kind, minimum duration, memory usage, and full-text search. Click into any query to see time-series charts for RAM, CPU, and I/O, a breakdown of ProfileEvents, per-thread role inference (which threads are doing aggregation vs. scanning vs. I/O), and memory allocation details.
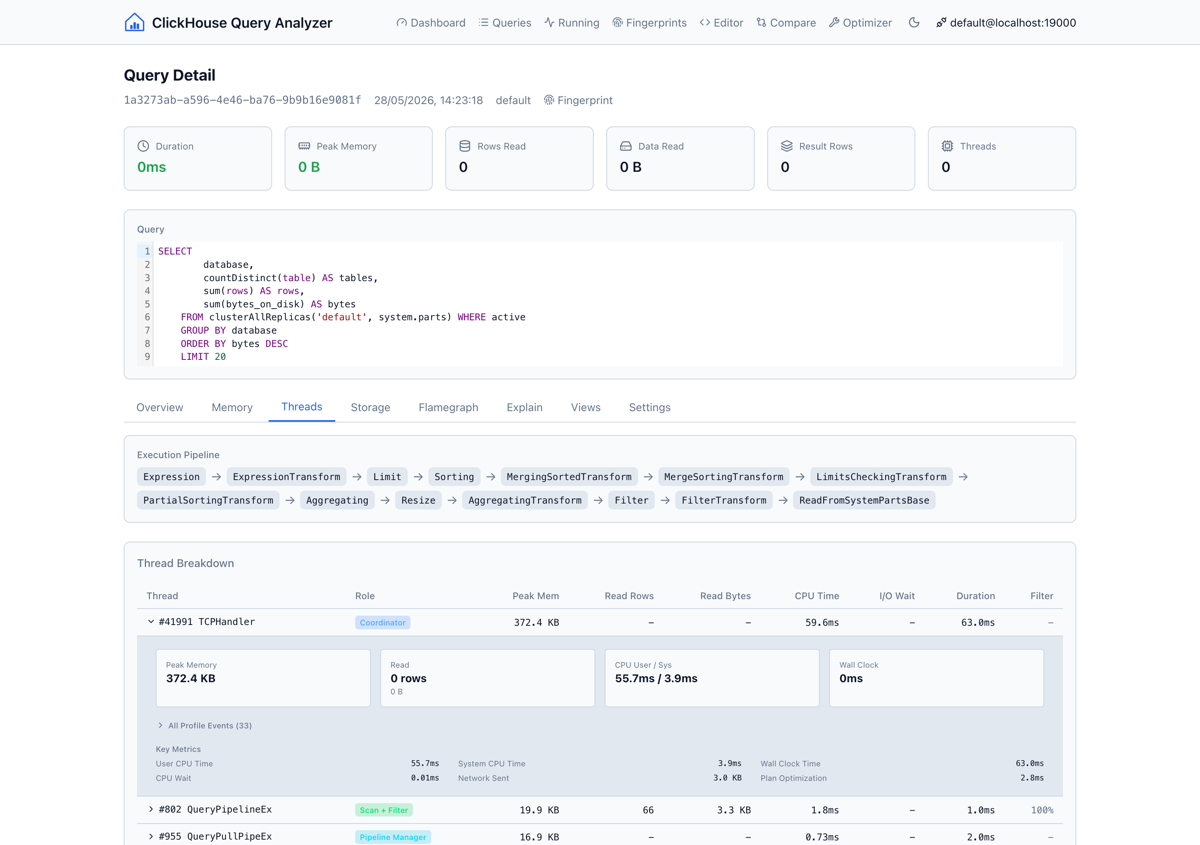
This is the view I kept missing: seeing what a query actually did, not just that it took 12 seconds.
Flame Graphs and EXPLAIN
The analyzer builds canvas-based flame graphs from system.trace_log, supporting five trace types: CPU, Real, Memory, MemorySample, and MemoryPeak. You get the standard zoom-in-on-hover behavior, so you can quickly find where time is being spent.
Alongside flame graphs, there’s an interactive EXPLAIN tree view that renders the execution plan as a collapsible tree, plus raw pipeline and syntax views for the full picture.
Query Fingerprints
Query fingerprints group queries by normalized_query_hash: same query structure, different parameter values. This lets you see aggregated stats per fingerprint: count, average, P50, P95 latency, memory usage, and I/O. Drill into a fingerprint to see performance trends over time at hourly or daily intervals.
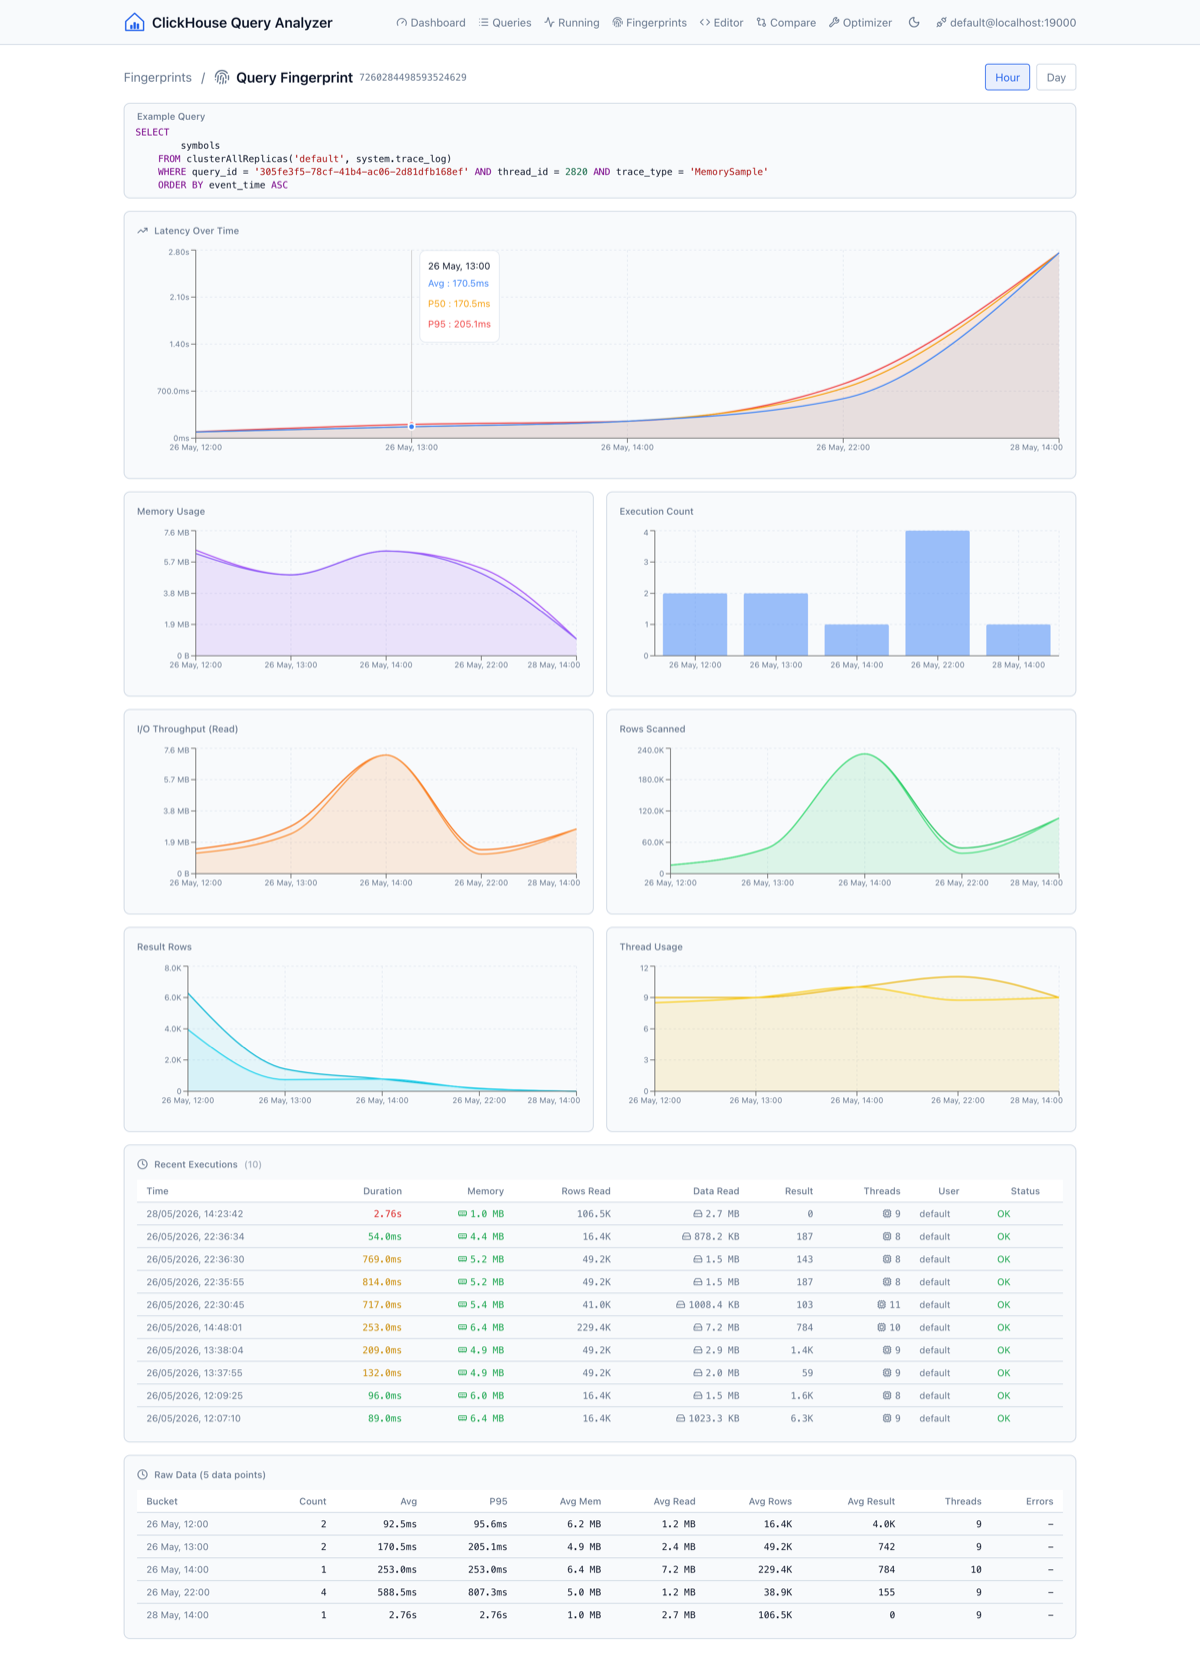
This is useful for catching gradual performance regressions that you’d never notice looking at individual queries.
SQL Editor
A full CodeMirror 6 editor with a schema browser sidebar that lists databases, tables, and columns with types. It supports parameterized queries through a {{param_name}} syntax that auto-generates input fields. Results link directly to the analysis view. Run a query, then jump straight into profiling it.
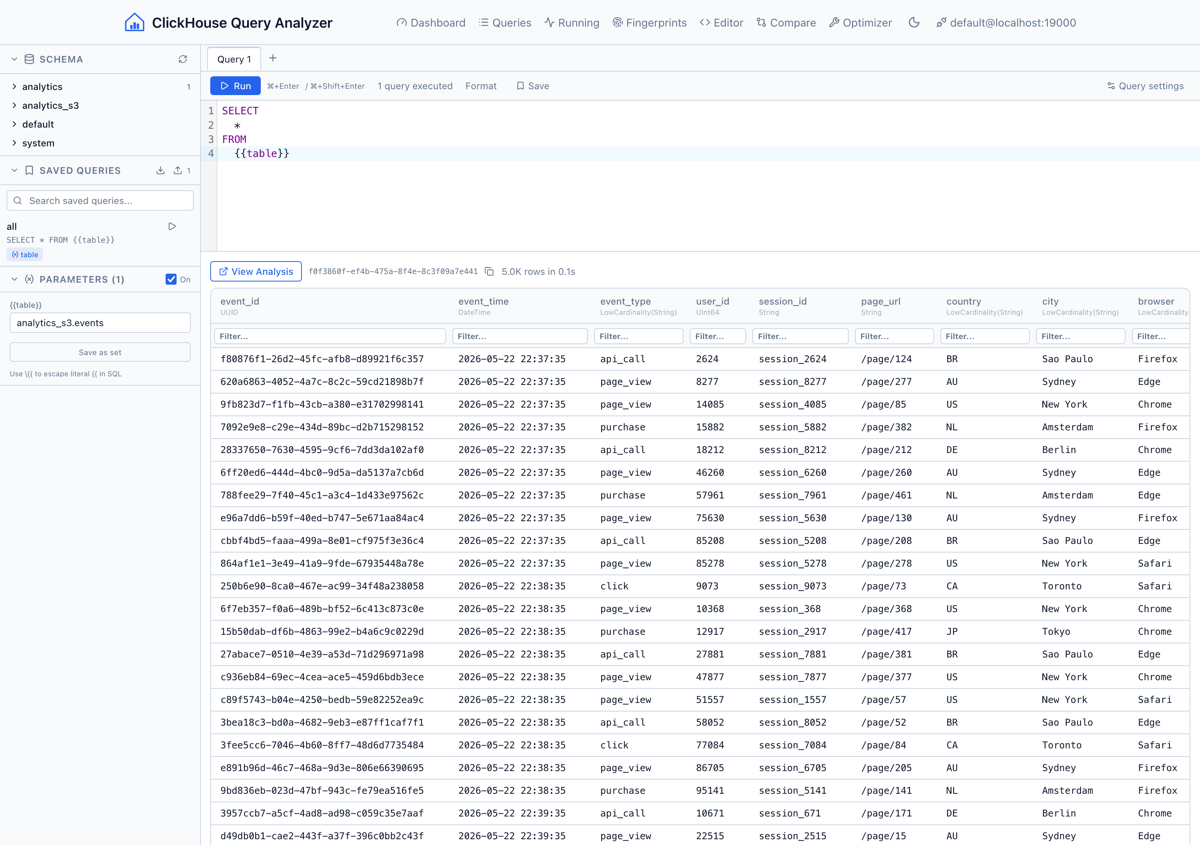
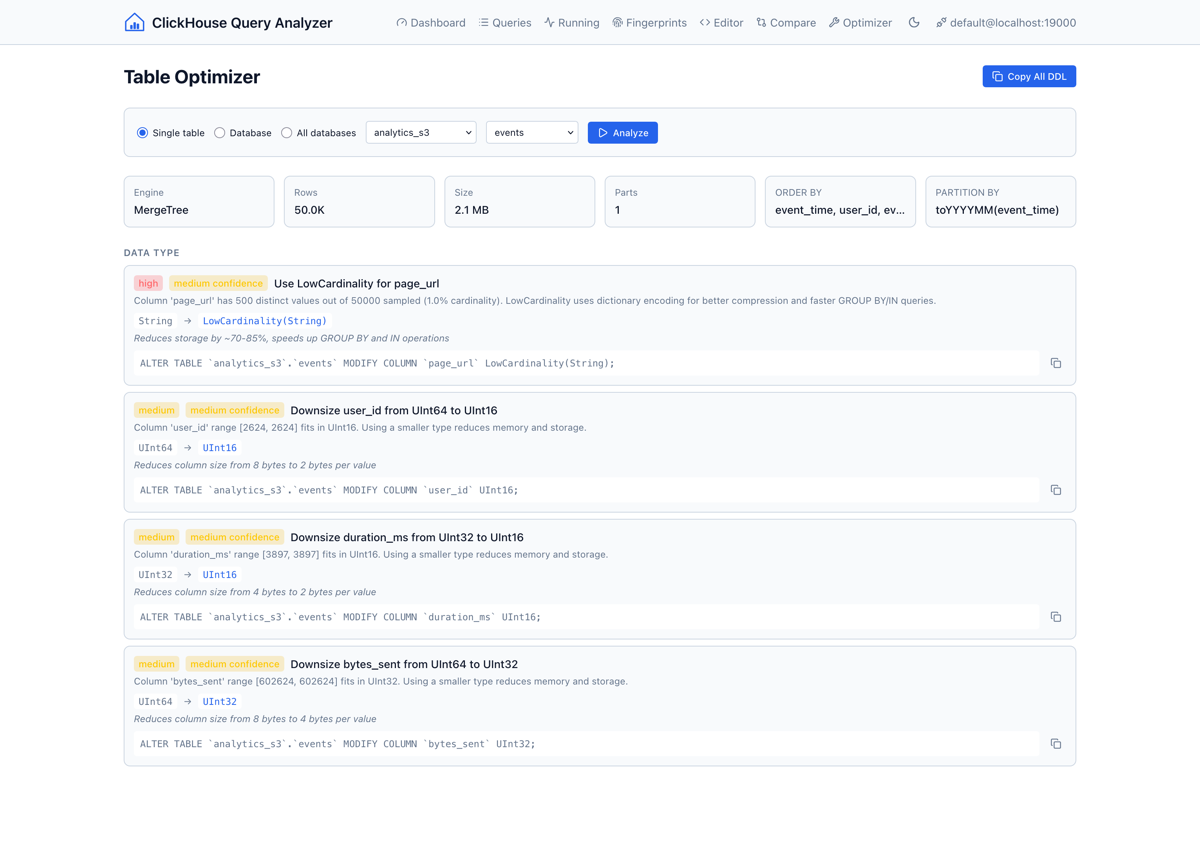
Table Optimizer
This is the feature that surprised even me in how useful it turned out to be. Point the optimizer at a table, a database, or all databases, and it samples column data to generate concrete ALTER TABLE recommendations:
- LowCardinality wrapping for string columns with low cardinality ratios
- Integer right-sizing: suggesting
Int32instead ofInt64when the data fits - Nullable removal for columns that have zero nulls in the sample
- Codec suggestions: DoubleDelta for sequential timestamps, ZSTD for high-cardinality strings
- Partitioning and skipping index recommendations
- Health checks: excessive parts, high bytes-per-row ratio
Each recommendation comes with a severity level, confidence rating, and copy-ready DDL.
Try It
The analyzer is open source and available as a single binary or Docker image. No setup wizard, no config file. Just connect and start debugging.
docker run -p 8080:8080 ghcr.io/nimbleflux/clickhouse-query-analyzer:latestThen open http://localhost:8080, enter your ClickHouse connection details, and you’re in.
- GitHub: Source code, releases, and documentation